


Klaviyo’s Custom Reports is a robust reporting tool that can help marketers and business owners improve revenues and profits. Here are five powerful tips to take your eCom email reporting to the next level
If you are already on this blog post, you know what Klaviyo Custom Reports are and have probably used some of these reports in your analysis.
These reports can be used to answer questions like:
- Where are drop-offs occurring in your message funnel?
- How much revenue are your messages generating?
- What messages have deliverability issues?
- Which products are your customers purchasing?
- What’s your revenue growth over time?
- and more
Introduction to Klaviyo Custom Reports
For those who are new to them, Klaviyo offers five types of custom reports:
- Single metric deep dive report
- Multi metric report
- Campaign performance report
- Flows performance report
- Product performance report.
If you want to brush up on what these reports are, the best place to start is with Klaviyo’s documentation.
This video will also give you more details.

Besides, when you go and open the Klaviyo Custom Reports page on your dashboard, you will find plenty of pre-built custom report templates in the library.
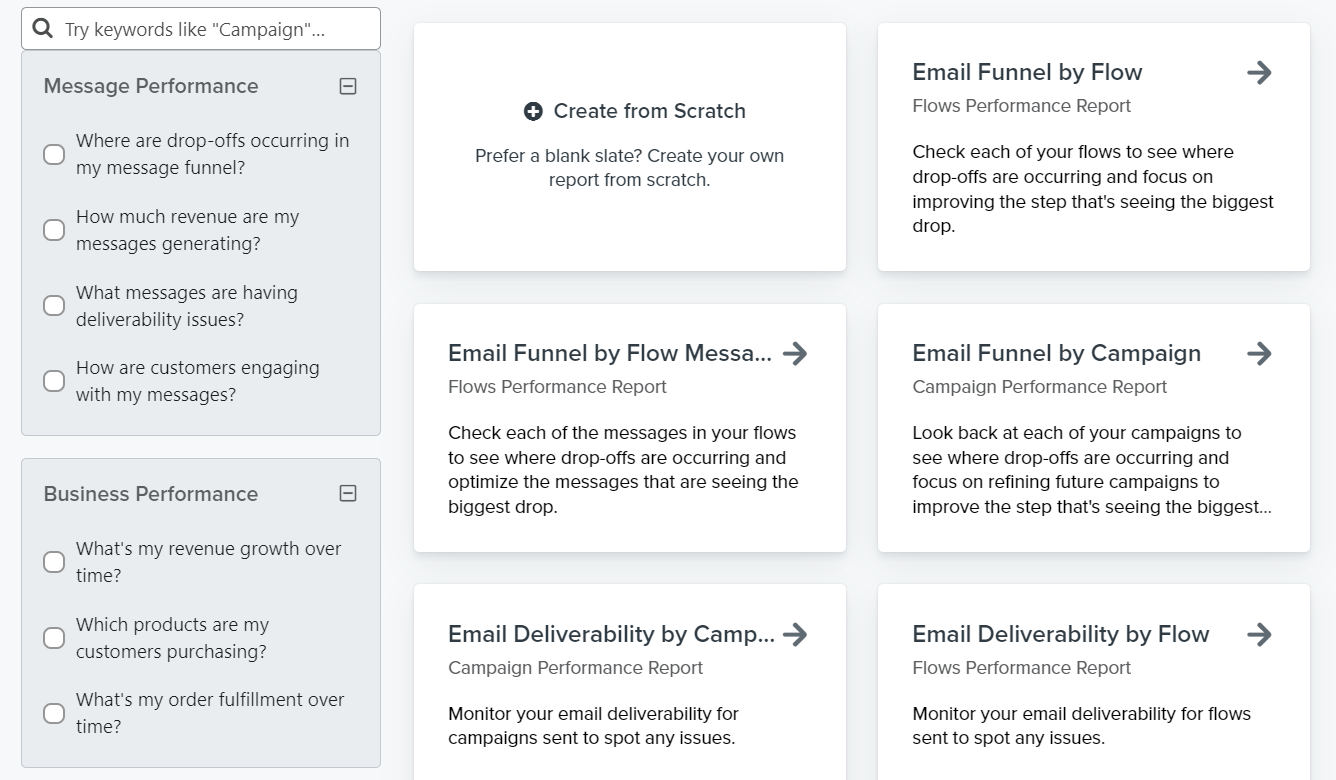
Klaviyo does a reasonably good job with these reports, and for most stores, you can get started with the pre-made ones: clicking on any one of these reports will throw up a screen that looks like this and tells you what to expect.
Once you have followed the prompts and generated the report, you can export it as CSV to analyse the number in Excel.
And for many use cases, this setup is enough: you don’t have to create reports from scratch, and you will have enough data to answer plenty of pressing business questions.
5 Advanced Klaviyo Custom Reports Tips
But what if you want to level up and go beyond the default options?
You are in luck: I have scoured through scores of forum posts, Slack and Facebook group posts, and Twitter posts to collect five advanced tips that will help you impress your boss/client and improve email marketing ROI ( I will keep updating this post as and when I come across different use cases).
1. Use 365 days while tracking flow and campaign revenue
When generating flow and campaign revenue reports, use the time frame of 365 days and run the reports at the end of every month.

This will give you an indication of YoY performance and will tell you whether revenue has increased as per your projections.
Having YoY data also helps you account for seasonal sales since sales ebb and flow.
Also, YoY data can uncover new business opportunities and shifts in customer behaviour: if your revenues dipped during Mother’s Day but increased during Father’s Day (unlike last year when Father’s Day pulled in more) you might want to take a deeper look.
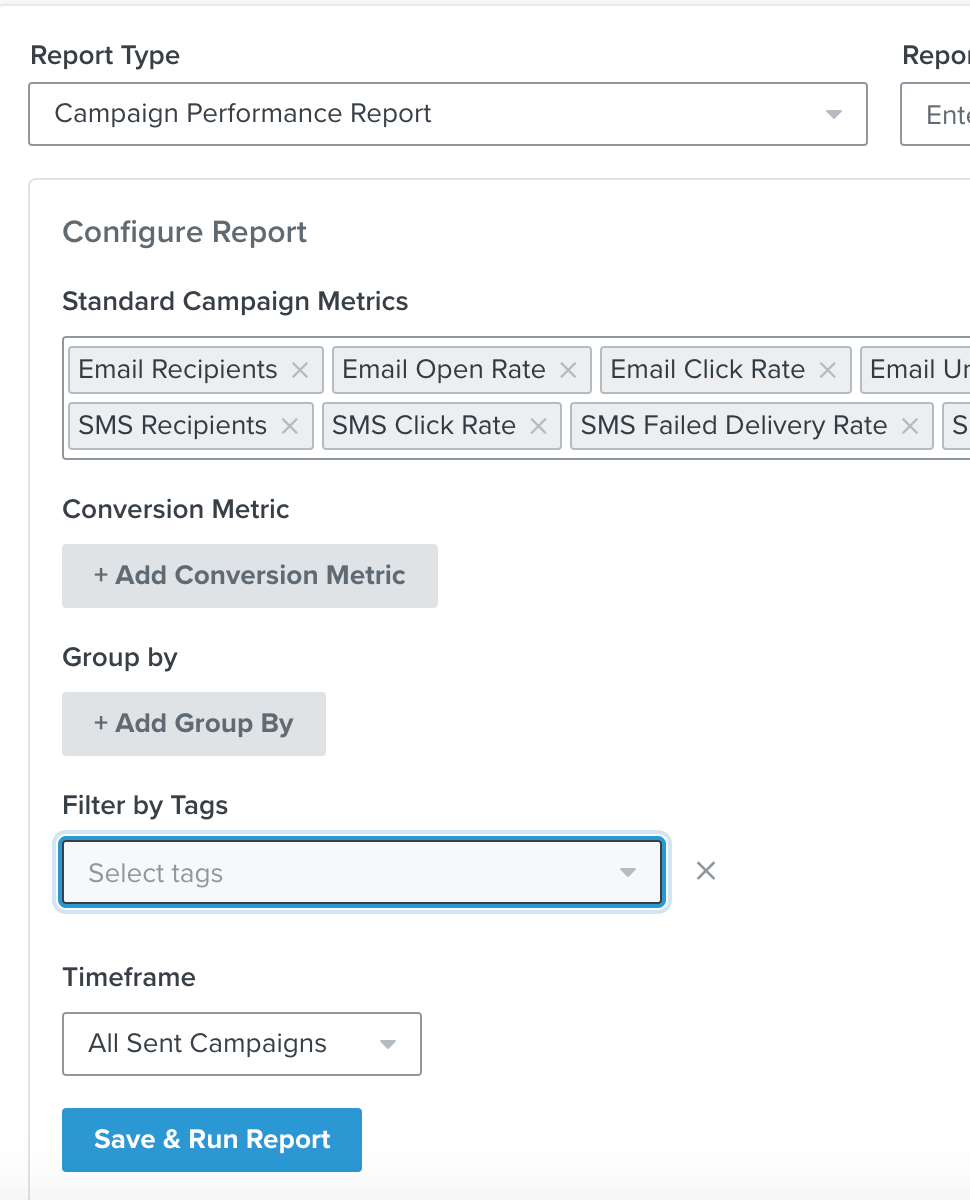
2. Use tags to create custom reports for certain campaigns
Many stores use the same Klaviyo setup to send out campaigns to both B2B and B2C customers.
But both these segments display diverse user behaviour, so it doesn’t make sense for an email marketer to look at consolidated data on the Klaviyo dashboard.
In such a scenario, you can tag new/existing campaigns with a specific tag and then use that tag to create separate custom reports.
3. Ignore Apple users who will inflate open rates
After Apple rolled out iOS21’s email privacy protection features, open rates as a metric are completely broken because Apple Mail automatically opens every email regardless of the user action.
To preserve the (limited) usefulness of open rates, you can ignore Apple users by creating a specific custom report whose settings are like this.
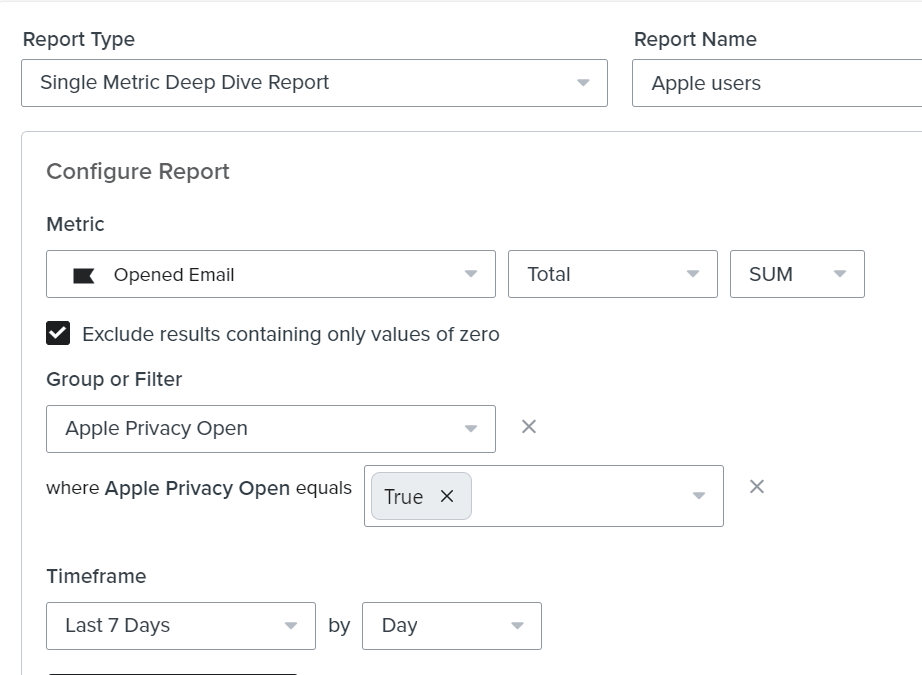
This issue has created a lot of friction and skewed plenty of reporting, so you might want to click on this help article and read more.
If a significant percentage of your user base uses iOS (which your analytics will tell you), you are better off not using open rates as an engagement metric (and instead, pivot to click rates that signal human interaction).
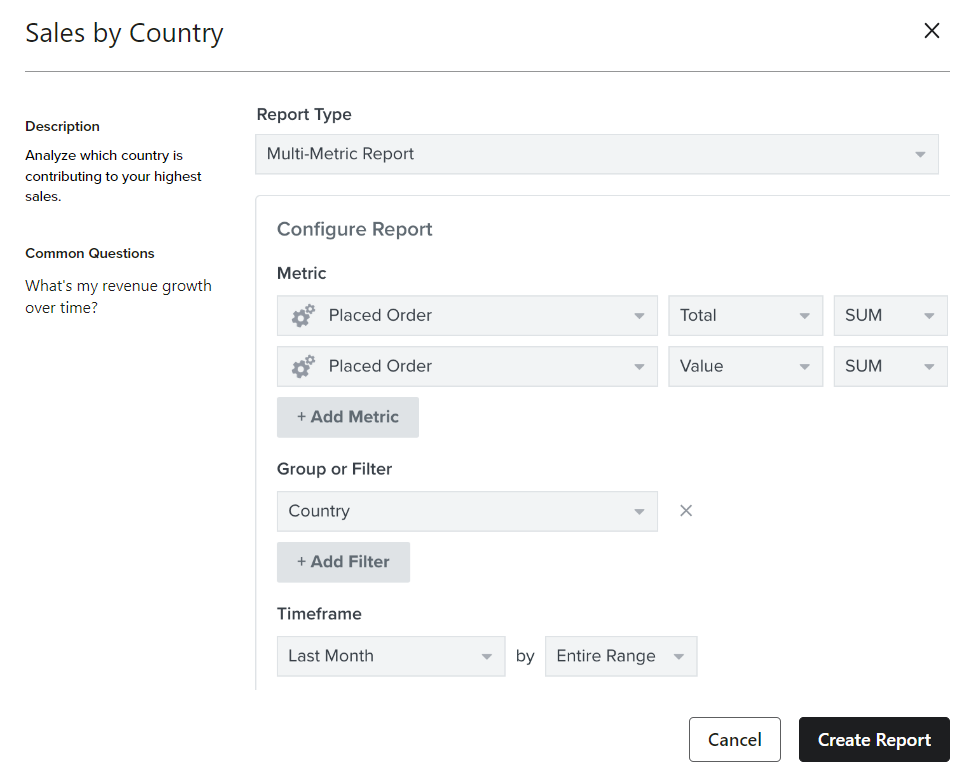
4. Understand SUM vs. AVG and Value vs. Total vs. Unique Profiles
These are two different ways in which you can slice and dice an individual metric while building Klaviyo reports. Here’s how it looks in the report configuration area.

Choose the wrong dropdown option, and your report will be all garbled.
Here’s a simple technique I use to determine which option I should pick based on a particular report:
- Total: to find out how many times something has happened (like click rates)
- Unique Profiles: to find out metrics associated with a person (people who unsubscribed)
- Value: to find the value of an action (revenue, average order value, etc).
- SUM: to find the total value of a metric
- AVG: to find the average value of a metric
5. Build a custom reporting plan
The most important tip to successfully leverage Custom Reports is to start from the end, i.e., your business requirements, and then make a reporting plan.
Then, use that plan to map out the metrics and the filters, and the profile properties that will best highlight the trends you are looking for.
Just for kicks, I asked ChatGPT what kind of Klaviyo Custom Reports I could create. Here are some examples it came up with:

You can run your own query and will probably get another set of examples (it’s another matter that some of these reports can’t be run because they are AI hallucinations).
Limitations of Custom Reports and next steps
Custom Reports is an evolving product, and there are certain limitations:
- You can’t clone custom reports across accounts and are restricted to whatever is in the Custom Reports Library (this would save time when you are setting up a new account)
- You can’t segment metrics like open or click rates by profile property (like location).
- You can’t create custom reports for new vs returning customers.
Some of these limitations could be worked around if you were to use Klaviyo API to pull data into a reporting tool or even into Google Sheets.
But that’s a tale for another day.
You can also export your Custom Report data into a tool like Google Looker Studio and visualise it, along with other metrics.