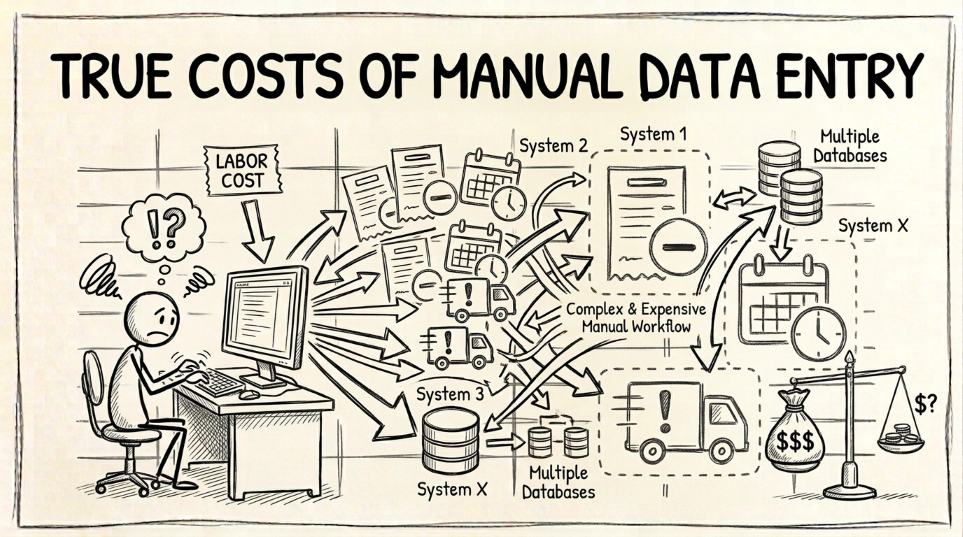
The full annual cost of manual data entry between your WMS, EDI, and ERP is more than copy pasting from one system to another. It also includes deductions from bad ASNs, hours reconciling mismatched reports, and rush freight from stale data, plus margin loss and stockout risk no report captures. In the calculator's default scenario, those three quantifiable lines roughly double the labor-only estimate.
Based on Pixels and Clicks' own manual data entry cost calculator methodology, cross-referenced with the deduction write-off pattern described in this site's EDI 856 coverage and the industry out-of-stock research cited in this site's OTIF coverage, August 2026.
If you run supply chain or operations for a $10M-$500M CPG supplier, your team likely manually updates numbers across multiple systems, like WMS, EDI, and ERP. Errors creep in, and you’ve probably spent a few late nights yourself reconciling numbers across different databases.
The labor cost can be considerable, say $30-40,000 in one year, but you may not have the bandwidth for a full-scale overhaul of the entire system right now. So you put it off.
But the costs of ignoring copy-paste workflows go way deeper, and can wreck a brand.
What does the labor-only cost estimate miss?
Start with margin, because margin is where a deduction actually lands.
A chargeback doesn’t come off next quarter’s revenue target, where you’d have a chance to make it up. It comes off an invoice for product that’s already been made, packed, and shipped, paid for once already in raw materials, labor, and freight. Every dollar written off there is a dollar of margin that’s gone, not a sales goal you missed and can chase next month.
Then there’s the supermarket shelf.
A re-keyed order that ships late, or an ASN that gets rejected and never resent, doesn’t just risk an OTIF fine. It can be the reason your product isn’t on the truck for the week Walmart resets a planogram, Target builds a Fourth of July end cap, or Kroger runs the promotion your trade spend already paid for.
Out-of-stocks cost the US food retail industry $15 to $20 billion a year in lost sales, and a shelf you didn’t stock that week is a shelf a competitor did. You can’t dispute that one six weeks later on a remittance. Someone else already made the sale, and it isn’t coming back.
And then there’s the buyer. Every rejected ASN and every late shipment lands on a scorecard a category manager reviews before the next planning cycle. That’s the same scorecard that factors into who gets more shelf space next year, and who gets a harder look at renewal.
A supplier whose data is clean gets the benefit of the doubt on the next dispute. A supplier who shows up as a repeat offender on shortage codes and late ASNs gets questioned, whether or not anyone ever says so out loud on a call.
None of that is on the labor spreadsheets you made when you were calculating the cost of copy-pasting. All of it is caused by the same three coordinators, re-keying the same orders, by hand, into two systems that don’t talk to each other.
That’s the case the manual data entry cost calculator is built to help you make, starting with the part you can actually put a number on.
What the labor-only estimate counts
The napkin formula is simple: coordinators, times hours per week, times loaded rate, times 52, plus a rework allowance for entries that need correcting later. At the calculator’s starting defaults, that’s three coordinators, eight hours a week, a $42 loaded rate, and an 8% rework rate, for a total of $56,609 a year.
That number is accurate. It’s also, by construction, only the part of the cost that shows up on a headcount or timesheet line. A finance reviewer comparing it against a coordinator’s salary sees a project that saves what it costs to run, and asks why it’s worth funding at all.
Where do the other manual data entry costs hide?
Three more lines belong in the total, and each already exists on a report you run, filed under a name that has nothing to do with manual typing.
Deductions and chargebacks come from your retailer scorecard or AP deduction report: shortage codes and ASN rejections traced back to a re-keyed field that didn’t match. Most teams stop disputing a deduction once it drops below roughly $150, because chasing it costs more in labor than it recovers. As a result, these losses get written off individually instead of counted as a pattern.
Reconciliation hours come from your ops calendar: the standing meeting where someone reads the WMS number, someone else reads the ERP number, and the two don’t match. Expedited freight comes from your carrier invoices: the rush premium paid because a shipment moved on data that hadn’t crossed from one system to the other yet.
Your own numbers will differ. That’s why the calculator asks for each one directly instead of applying a fixed multiplier to your labor line.
Why isn’t anything on your dashboards labeled “manual data entry”?
IT sees a headcount number. Finance sees individual deduction line items on a remittance. Ops sees a calendar invite for a recurring reconciliation call. Freight sees a rush charge on an invoice. Each of those people is looking at a real cost caused by the same missing integration, and none of them is looking at a report that names it.
Because no single line item owns the whole picture, the cost rarely gets added up. It stays invisible to whoever is deciding whether to fund the fix.
Five numbers you already have
Completing the quantifiable total takes five inputs, each pulled from a report or calendar you already keep:
- Data-error incidents per month. Rejected 824s, ASN rejections, and manual order corrections, every account combined, from your EDI portal or retailer scorecard.
- Average cost per incident. The typical deduction or write-off tied to one bad transmission, from your AP deduction report.
- Reconciliation hours per week. The recurring meeting where a WMS number and an ERP number get compared by hand, from your ops calendar.
- Expedited shipments per month caused by stale data. Rush shipments where the real cause was a data lag, not demand, from your freight invoices.
- Average expedite premium. The rush charge over standard freight on those same invoices.
None of these need a new report. They need five numbers pulled off reports that already exist, placed next to the labor line for the first time.
How does the full cost number change the business case?
Bring finance a labor-only estimate, and the project reads as one salary’s worth of savings.
Bring the full number, labor plus deductions plus reconciliation hours plus rush freight, and the same project reads as a structural cost with its own budget line. Right now, that cost is paid in installments across four different reports, and it never shows up anywhere as a single figure. That’s before you even mention the margin, the stockouts, or the buyer relationship. The calculator can’t price any of those, and all three keep getting worse for as long as the re-keying continues.
The ratio between the two quantifiable numbers in the calculator’s default scenario is roughly 2x. Yours may run higher or lower, depending on how much deduction and rush-freight history has built up around your own systems. Measuring it, not assuming a fixed multiple, is the point.
A shortage deduction like Walmart’s code 22 is one concrete example of a cost that starts as a re-keying error and lands three reports away from the coordinator who made it.
NetSuite users have their own specific version of this problem: five gaps that turn a clean shipment into exactly this kind of deduction. Run your own five numbers through the manual data entry cost calculator and you’ll see where yours compute.
If the total surprises you, the data-bridge assessment maps every manual handoff in your operation and prices what to fix first.
Frequently Asked Questions
- Why does the manual data entry cost calculator ask for deductions and freight costs, not just labor hours?
- Labor hours are the visible part of what manual data entry costs. The rest lands on other reports under other names: deductions traced to bad ASNs, hours spent reconciling reports that disagree, and rush freight caused by stale data. Adding those in gives the full annual cost, not just the part that shows up on a labor spreadsheet.
- Where do I find the 'data-error incidents per month' number the calculator asks for?
- Your EDI portal or retailer scorecard. Count last month's rejected 824s, ASN rejections, and manual order corrections across every retailer account you run, and use that total.
- Is the 2x multiplier in the calculator's example the same for every company?
- No. It's the ratio produced by the calculator's starting defaults: three coordinators, twenty incidents a month, four reconciliation hours a week. Enter your own five numbers and the ratio will move, higher for some operations, lower for others.
- What if I don't track reconciliation hours or expedite premiums yet?
- Estimate them for a first pass. A rough number beats leaving the field at zero, which understates the total. The standing meeting where two systems disagree and the rush charge on a recent freight invoice are both easy to reconstruct from memory even without a formal log.
- Does the calculator account for stockouts or lost shelf space?
- No, and that's on purpose. Stockout risk and buyer trust are real costs of manual data entry, but they're not consistent enough dollar figures to model in a calculator. The five inputs it does ask for are all costs you can pull from an existing report, which keeps the output defensible instead of speculative.
- How is this different from the OTIF calculator?
- The OTIF calculator prices a shipment-performance gap against retailer fine schedules. The manual data entry cost calculator prices the re-entry between your systems: labor, rework, deductions, reconciliation time, and rush freight. That's what often causes the gap in the first place.
Find out what your deductions are actually costing you.
A 30-minute call with the founder, who will tell you which of the three scans fits your problem, or that none of them do.