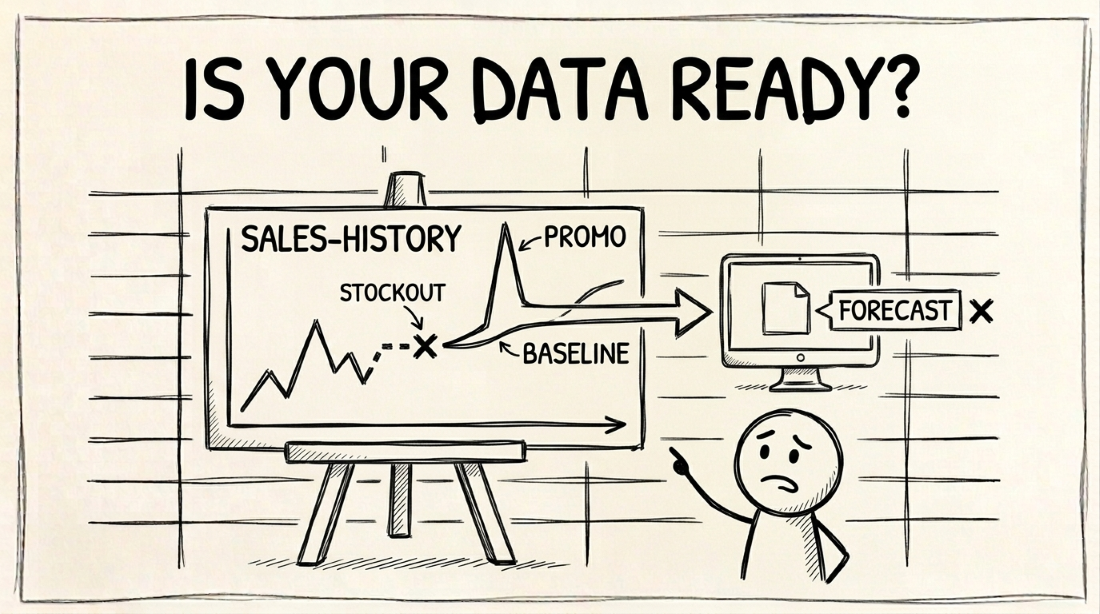
CPG demand-forecasting data readiness means your SKU history, unit-of-measure consistency, promotional flagging, and master-data hygiene can support a statistical model before you buy one. A platform can run a technically correct forecast on messy inputs and still produce numbers you shouldn't order against. The six checks: history depth, UOM consistency, promo/baseline separation, master-data change control, stockout-vs-zero-demand distinction, and accuracy tracking.
Based on Oracle NetSuite's demand-planning documentation, the Institute of Business Forecasting's MAPE reference, and CPG-specific trade-promotion forecasting guidance (Vividly), August 2026.
You’re a VP of Operations or Director of Supply Chain at a $10M-$500M CPG supplier, and the forecasting platform went live three months ago. The dashboard looks right. The vendor’s onboarding team signed off.
Then the numbers start missing, not randomly, but in a pattern: promoted SKUs come in low, and the items that stocked out last spring keep coming in low again. Within a quarter of go-live, your planners are back to overriding half the output by hand.
Your vendor didn’t sell you a broken algorithm. Netstock, o9, and Blue Yonder all run defensible statistical methods.
What broke is the data feeding the model: the sales history, the unit-of-measure fields, the promotional calendar, the SKU master, all the raw material a forecast is built from. A platform can run a technically correct calculation against that raw data and still hand you a forecast you shouldn’t order against.
By the time that shows up, you’re several months into an annual contract. The fix isn’t a support ticket. It’s redoing the data work you needed before you signed.
That’s what a forecasting-readiness check is actually scoring, and it comes down to six things.
How much sales history does a forecast actually need?
Oracle’s own NetSuite demand-planning documentation doesn’t state a minimum. Its statistical methods, Linear Regression, Moving Average, and Seasonal Average, each run against a configurable Historical Analysis Duration: a number of past periods you set yourself. The system calculates against however many periods you give it, clean or not.
When an item has no transaction history at all, NetSuite’s documented options are:
- Borrow history from an alternate source item
- Import external sales-order history
- Forecast that item manually
None of those is “the platform figures it out for you.”
What actually matters is continuity, not a specific year count:
- A model separating a genuine trend from ordinary week-to-week noise needs enough clean periods to tell the difference.
- A seasonal category needs at least two full cycles before a model can distinguish “this spikes every December” from “this happened to spike once.”
- A single clean year with no promotional or stockout gaps in it can outperform three years riddled with them.
Depth helps, but only once the periods you’re feeding in are actually usable.
Why a unit-of-measure mismatch wrecks a forecast before the model runs
A forecast built on cases when your item master half-tracks eaches doesn’t fail with an error message. It fails by a clean multiple instead. That’s the same case-pack-sized drift that shows up as a shortage deduction when an ASN gets the same field wrong.
The trap: a UOM error doesn’t look like an error. It looks like demand that’s twelve times higher or lower than reality, plausible enough that a planner might not question it on the first pass.
Anchor Group’s NetSuite demand-planning guidance names the same pre-work every time, before you run a plan, not after:
- Standardize units of measure across product categories.
- Audit sales data for accuracy: remove outliers, test transactions.
- Verify item master records include vendors and lead times.
Do this before history depth or promo flagging start to matter. A clean UOM field on a shallow history beats a deep history built on an inconsistent one.
Why promotional demand has to be forecast separately from baseline demand
Two demand signals, not one:
- Baseline demand is what you’d sell with no promotion running: steady-state volume driven by distribution, shelf placement, and repeat purchase. It moves slowly.
- Promotional lift is the incremental volume one specific promotion generates on top of that. It’s event-driven, temporary, and varies by retailer and promotion type. A 10% TPR at one retailer doesn’t generate the same lift as a 15% TPR at another.
Blend the two together and the forecast anchors to the wrong number. A quarter that included a retailer reset or a BOGO campaign gets treated as ordinary volume, and the next quarter’s forecast inherits that inflated baseline.
Vividly’s CPG-specific forecasting guidance names the resulting pattern directly:
- Stockouts during the next promotion, because the model never saw the last one as an anomaly.
- Excess inventory once it ends, because the baseline it’s still forecasting against was never real.
What master-data change control has to do with forecast accuracy
A SKU hierarchy and item master that anyone can edit without a change-control process will drift. A forecasting model has no way to tell a legitimate reclassification from a mapping error.
If a SKU’s category, UOM, or vendor-item cross-reference changes mid-history with no record of when or why, the model does one of two things:
- Splits one continuous demand history into two shorter, noisier ones.
- Blends two genuinely different items into one that never existed.
Profisee’s supply-chain master-data guidance makes the same point from the governance side: consistent, well-structured item data is what makes inventory numbers legible across purchasing, production, and planning in the first place. A model can only be as coherent as the item records feeding it.
This is the same failure class covered in NetSuite EDI 856 failures. A cross-reference table gets rebuilt during a migration and re-mapped incorrectly, pointing a live item at the wrong record with nothing to flag it. There, it turns into a shortage deduction. Here, it turns into a forecast trained on a demand history that never actually described one item.
Why a stockout looks identical to real zero demand
Sales history records a stockout and a genuine zero-demand period the same way: zero units sold. A statistical model reading that history can’t tell the difference on its own.
As one practitioner guide puts it: “If you use that zero to plan next month without making any corrections, your system effectively plans to fail again because it assumes there was no demand.”
That’s a self-reinforcing pattern, not a one-time miss:
- An item stocks out. Sales drop to zero for reasons that have nothing to do with demand.
- The model reads that zero as low demand and forecasts a lower number going forward.
- The next order is smaller than it should be, so the item is more likely to stock out again.
- Repeat, on exactly the SKUs where an understock costs the most: your fastest movers.
If your data doesn’t flag which zero-sales days were “we had none in stock” versus “nobody wanted it that day,” a platform can’t fix that for you. It can only forecast against whichever version of history you hand it.
How to tell if a forecast is actually getting better
MAPE (Mean Absolute Percentage Error) averages the gap between what you forecasted and what actually sold. It’s expressed as a percentage, so it’s comparable across SKUs with very different volumes.
There’s no universal “good” MAPE:
- A stable, low-promotion category can run a tight number.
- A category with frequent, unpredictable promotions runs one that looks worse by comparison, and may still represent a well-run forecast.
What matters more than any single threshold is whether you’re measuring consistently enough to see the trend, and whether you’re measuring the right thing. Blending baseline and promotional accuracy into one MAPE number hides which one is actually driving your misses. Track these separately instead:
- Baseline forecast accuracy
- Promotional-lift accuracy, by event type
- Forecast bias: are you consistently over- or under-forecasting in one direction?
You’ll usually find the real problem is concentrated in one of the two, not spread evenly across both.
The verdict, before you sign anything
None of these six checks require a platform to run. They’re audits of what you already have:
- Pull a year or two of transaction history.
- Check it for UOM consistency.
- See whether promotions are flagged as their own field.
- Look for a documented split between “no stock” and “no demand” in your sales-history records.
That audit tells you one of three things:
- Your data can support a platform today.
- It can support one once a specific, nameable gap is closed.
- It’s not close enough to be worth a vendor conversation yet.
Our forecasting readiness quiz scores exactly these six dimensions in about two minutes. If the gaps turn out to be more than a quick self-check can size, the forecasting feasibility assessment is a fixed-scope, vendor-agnostic read on your actual SKU-level data. It’s done before you’re the one explaining to a VP why the platform you championed keeps missing on the SKUs that mattered most.
If a detail here doesn’t match your own platform’s documentation, tell us and we’ll correct it.
Frequently Asked Questions
- How many years of sales history does a demand-forecasting platform need?
- There's no universal number, and Oracle's own NetSuite demand-planning documentation doesn't state a minimum. What matters is continuity: enough clean periods to separate a real trend or seasonal pattern from ordinary noise. A seasonal category typically needs at least two full cycles to tell the two apart. Less than a year, or a year full of gaps, is the tier our own readiness quiz scores as not ready.
- What is MAPE, and what counts as a good score?
- MAPE (Mean Absolute Percentage Error) averages the absolute percentage gap between what you forecast and what actually sold. There's no universal "good" threshold; it depends on category, volatility, and horizon length. What matters more than the number itself is whether you're tracking it consistently enough to know if it's improving.
- Can I run a forecasting platform if my promotional and base demand aren't separated yet?
- You can run it, but expect the forecast to be wrong in a predictable direction. A quarter with a major promotion inflates what the model treats as your steady-state baseline, so the next quarter's forecast inherits demand that isn't there, and you over-buy against it. Separate the two before go-live if you can; if you can't, treat the first two quarters of forecasts as suspect.
- What's the difference between a stockout and real zero demand in forecasting data?
- A stockout is demand that existed and went unmet; a zero-demand period is demand that genuinely wasn't there. Sales history records both as the same zero. A model that can't tell them apart learns that an item sells less than it does, and forecasts accordingly, training itself cycle after cycle to keep you understocked on exactly the items that stocked out before.
Find out what your deductions are actually costing you.
A 30-minute call with the founder, who will tell you which of the three scans fits your problem, or that none of them do.