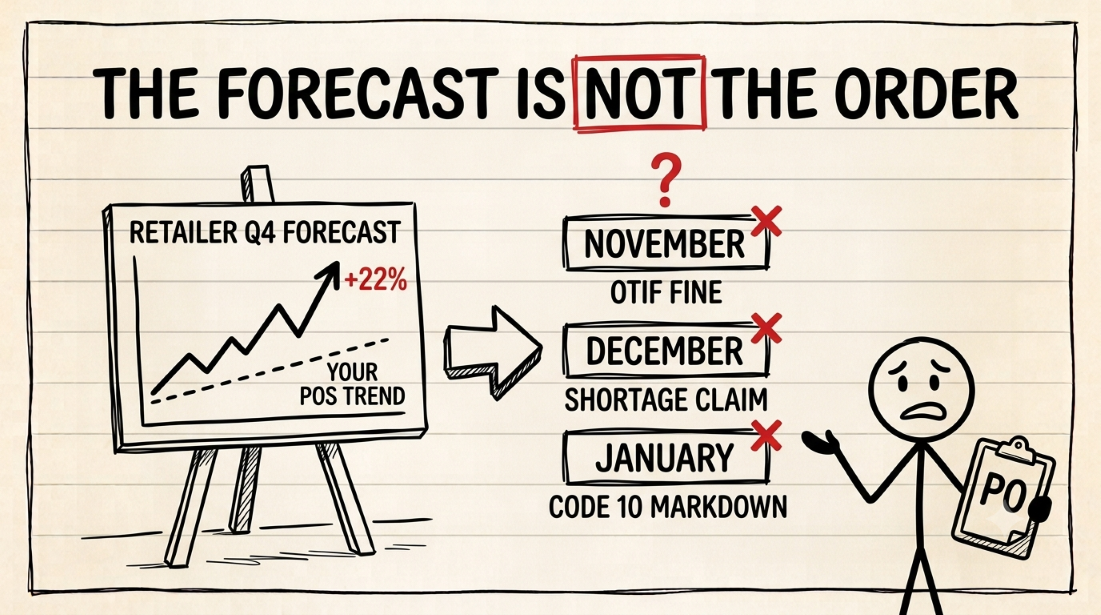
Retailer peak-season forecasts routinely overstate demand by 10 to 25 percent, and accepting one without running a supplier-side counter-forecast commits you to inventory and capacity you may not clear. The trap is not the forecast. The trap is treating it as an order commitment. Build a POS-driven counter-forecast, flag any line where the retailer number sits more than 15 percent above your own, and negotiate the delta before you cut a purchase order to your co-packer.
Based on public forecasting and retailer-compliance documentation from SPS Commerce, BOLD VAN, Endless Commerce, and Supply Chain Dive, September 2026. Retailer forecast tools and thresholds vary by program.
You’re the VP of Supply Chain at a $60 million CPG supplier. It’s early September. Your Walmart buyer just sent the holiday forecast: 2.1 million units on your best-selling line for October through December, a 22 percent lift over last year’s peak. Your co-packer needs a firm order in 10 days to hold the run. Your finance lead wants a working-capital plan by Friday.
The forecast looks generous. It reads like a growth signal. If you accept it, you sign purchase orders with your co-packer, book inbound freight for the imports that feed the line, and reserve DC slots that would otherwise cover three other retailers. That’s the trap.
The forecast is not the order. The buyer’s lift is not a commitment. Category buyers face asymmetric risk in a peak plan. An out-of-stock in November costs them a sales miss and lost shelf space. An overstock in January costs them a markdown that hits your P&L through Walmart code 10 or a returns claim under codes 92, 93, and 94. The buyer’s forecast optimism is your working-capital exposure.
Why the buyer’s number leans high
Buyers plan against a distribution of outcomes. Their bonus and their shelf space depend on covering the peak. Under-forecasting by 15 percent at Thanksgiving means an out-of-stock the merchant will hear about from the store team, from the DC team, and from the customer. Over-forecasting by 15 percent means a January conversation with the supplier about markdowns and returns.
The first conversation costs the buyer directly. The second conversation costs you.
That is not a criticism of any specific buyer or program. It is the structural incentive built into the peak-planning cycle. Every major program from Walmart’s forecast collaboration through Target’s OTIF planning to Kroger’s replenishment feed carries some version of this asymmetry. Your job is to price it before you commit.
How the trap becomes a Q4 chargeback
Two paths get you to a chargeback.
Path A: PO cut, stranded stock. You committed to the retailer’s peak number in September. Your co-packer produced against the commit. Your DC filled with the peak inventory. In mid-November, the retailer trims the December POs by 20 percent because their sell-through is running below plan. Your inventory is now sitting long, freight capacity is committed to the peak plan, and your other retailers see the effect: capacity you had reserved for them gets redirected to hold the Walmart plan together. Your OTIF drops on the other accounts, not on the account that caused it.
Path B: Sell-through miss. The retailer holds the peak forecast, receives the full shipment, and marks down the excess after Christmas. The markdowns come back to you as price-difference deductions under code 10, and the leftover units come back as returns under codes 92, 93, and 94. The OTIF fine is not the biggest line on that January remittance. The returns and markdowns are.
Both paths trace back to the same September decision. The forecast was not the problem. Accepting the forecast without a counter was.
Build a counter-forecast before you commit
The counter-forecast does not need to be sophisticated. It needs to be defensible. Pull three signals for each SKU on the retailer’s peak list:
- Last year’s sell-through at the same account across October through January, weekly.
- Current 8-week velocity at the same account, weekly.
- Any known distribution or promo change: a new POG, a lost store count, a competitive delist, a promo the retailer has already confirmed.
Run the two-year comparison. If the retailer’s peak forecast sits within 15 percent of what those three signals project, sign the order. If it sits above 15 percent, do not decline. Draft a counter-forecast note to the buyer with the specific delta, the source data behind your number, and a proposed stepped commitment.
The stepped commitment is the negotiation move. It typically looks like this: firm on 60 to 70 percent of the retailer number for October and November receipts, flexible on the December balance pending a mid-November velocity check, with a case-pack contingency in place if the retailer wants to convert flexible units to a promo package. Buyers hear this every peak from experienced suppliers. Suppliers who accept without a counter carry the write-down alone.
Your forecasting readiness for that conversation depends on how quickly you can pull the three signals. If it takes your analyst three days to build a counter-forecast for one SKU, you cannot cover a 40 SKU peak list before the co-packer deadline. That is a data-readiness problem, and it shows up every September, not just this one.
What a counter-forecast note looks like
The counter-forecast note is short. Two paragraphs plus a table. The buyer does not have time for a memo, and a memo is not what earns the negotiation.
The table lists SKU, retailer forecast, your counter, and the delta as a percentage. The paragraphs name the signals you used (last year’s sell-through, current velocity, any distribution change), the specific delta you are flagging (SKUs where the retailer number exceeds your counter by more than 15 percent), and the stepped commitment you are proposing. Send it inside the retailer’s forecast tool if the tool supports supplier notes. If it does not, send it as an email to the buyer with the tool’s forecast reference number in the subject line.
The buyer will do one of three things. Accept the counter (rare on a first cycle, common by year three). Push back with a demand argument you have to price (also fine, at least you now know what the buyer is planning against). Or send you back to the retailer number without a counter (in which case the risk shifts to you, but you have a documented record of the flag, which becomes evidence if a January dispute follows).
Where forecasting connects to deduction risk
The forecast readiness assessment exists for this decision cycle. If your team is spending three days per SKU on a counter-forecast, you cannot cover a 40 SKU peak list inside the co-packer window. The assessment traces where your data lives, how fast it can be pulled, and what the shortest path is between a retailer forecast tool and a defensible supplier counter.
The OTIF Deduction Assessment covers the downstream side: if this cycle already produced a peak commit that is now driving November misses, the assessment identifies which POs are still recoverable and where the root cause sits.
What to do next
Pull your last three years of remittance data for the January window. If the January remittance runs materially larger than the mid-year average, the peak-forecast cycle is a big lever, and this cycle is the one to move on. Draft one counter-forecast for the largest peak line before your co-packer deadline this week. That single note tells you whether your data is ready for the other 39 SKUs.
The Q4 deduction cliff covers the calendar of what actually spikes on your remittance between October and February, month by month, so the peak commit conversation is grounded in specific dollar exposure rather than a general sense that Q4 is expensive.
The disclaimer: retailer forecast tools, thresholds, and program details change without notice. Verify current program specifics in your own retailer portal before signing a peak commitment.
Frequently Asked Questions
- Why do retailer peak-season forecasts overstate demand?
- Category buyers face asymmetric risk. An out-of-stock at peak costs them shelf space and a sales miss. An overstock at peak costs them a markdown that hits the supplier through code 10 or a return. The rational buyer forecast leans high because the downside falls on your P&L, not theirs. This shows up most in first-year holiday programs and in categories with new SKU launches.
- What should I do when a retailer forecast is 20% above my POS trend?
- Send a counter-forecast referencing your own POS data, last year's sell-through at the same account, and any current velocity signal. Ask the buyer for the assumption behind the peak lift. Do not decline. Propose a stepped commitment: firm on the first half, flexible on the second, with a case-pack contingency plan. Buyers negotiate this every year. Suppliers who accept without pushing back carry the write-down alone.
- How does an inflated peak forecast create OTIF risk?
- Two paths. The first: you commit inventory, freight, and DC space to the inflated line, then a mid-November PO cut leaves the balance stranded. Your OTIF drops on the next PO because you rerouted capacity to hit the peak plan. The second: the retailer holds the forecast, sell-through underperforms, and the retailer marks down or returns the excess in January. That comes back as code 10 or codes 92, 93, 94.
- Can I dispute an OTIF fine caused by a retailer forecast miss?
- The OTIF fine is a program-level chargeback measured on your aggregate on-time and in-full rate, not a per-shipment dispute. A forecast miss that damaged your fill rate is not disputable as an OTIF line. You can dispute the underlying shortage codes on the specific POs, but not the scorecard math. The prevention is upstream, before the forecast becomes an order.
- What is the cost of accepting a peak forecast without a counter-model?
- It varies with category and lift, but a typical outcome for a $50 million CPG supplier accepting a 20 percent inflated Q4 forecast: two to three points of OTIF drop in November, 60 to 90 days of unproductive inventory carrying cost, and a January markdown deduction of 1 to 3 percent of the affected receipts. The forecast decision in September is a working-capital decision as much as a fill-rate decision.
Find out what your deductions are actually costing you.
A 30-minute call with the founder, who will tell you which of the three scans fits your problem, or that none of them do.